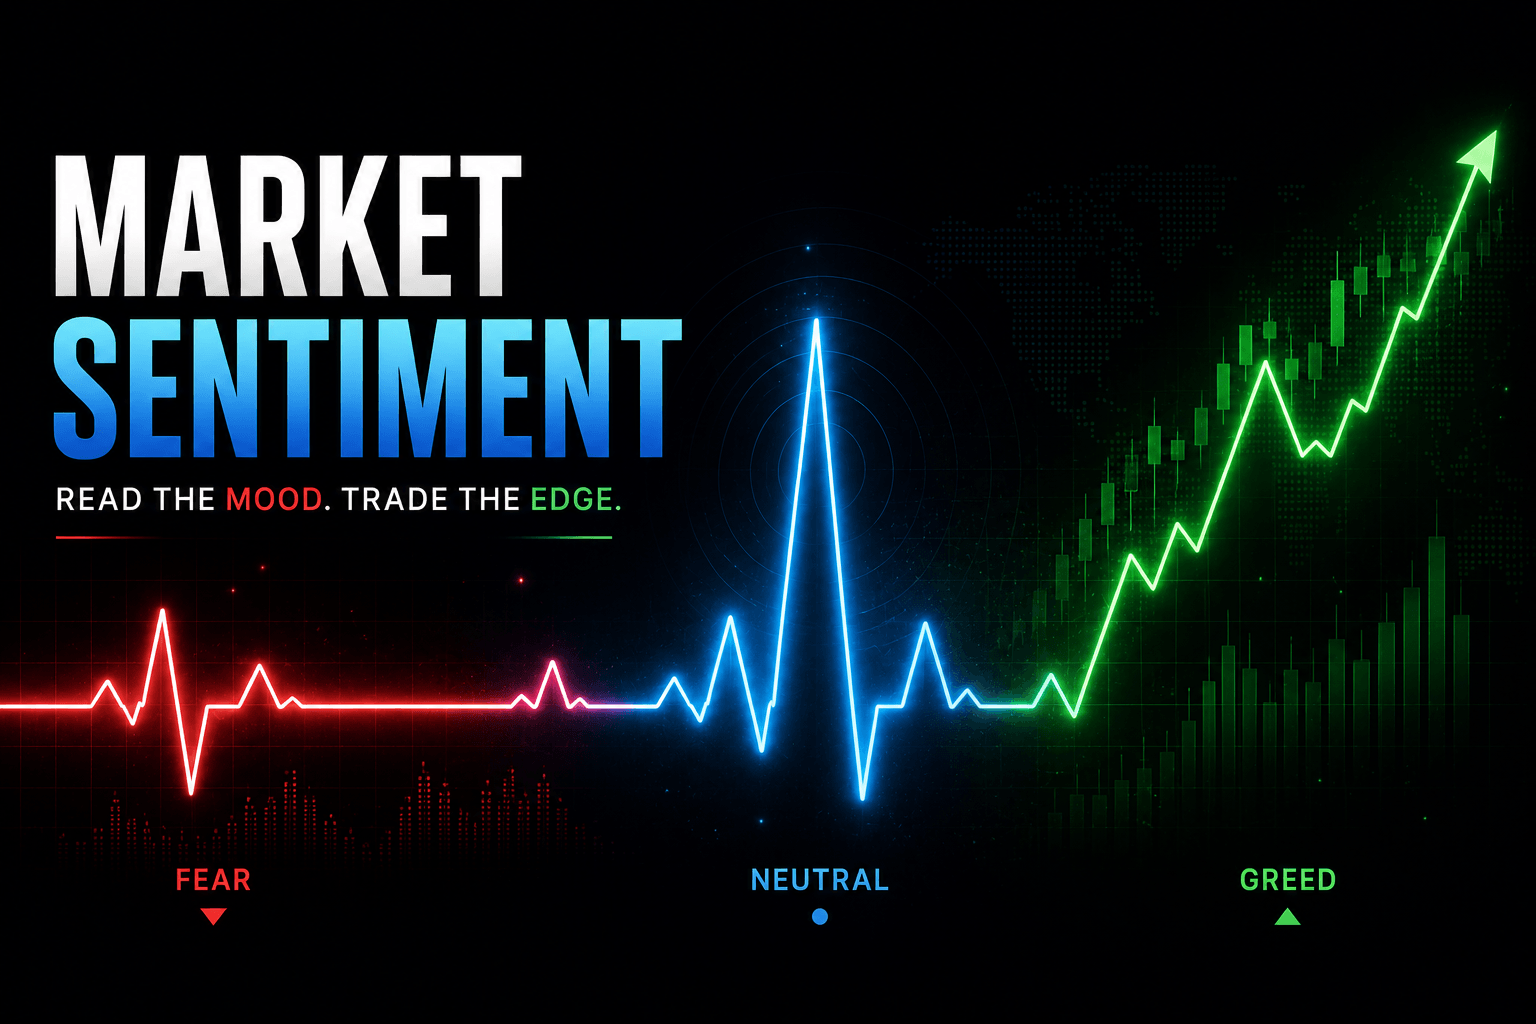
Market sentiment analysis has become an essential tool for traders seeking to understand the psychological forces driving price movements. This analytical approach examines the overall attitude of investors toward a particular market or security, providing valuable insights that can complement traditional technical and fundamental analysis.
Understanding market sentiment helps traders identify potential turning points, gauge market momentum, and make more informed trading decisions. By analyzing the collective emotions and opinions of market participants, you can better position yourself to capitalize on emerging opportunities while managing risk effectively.
This comprehensive guide will explore the fundamentals of market sentiment analysis, examining various tools and techniques that can enhance your trading strategy and improve your market timing.
What Is Market Sentiment Analysis?
Market sentiment analysis measures the overall emotional state of investors and traders in financial markets. It captures whether market participants feel optimistic (bullish), pessimistic (bearish), or neutral about future price movements. Unlike technical analysis, which focuses on price patterns and volume, or fundamental analysis, which examines economic data and company financials, sentiment analysis delves into the psychological aspects of trading. This approach recognizes that markets are driven not just by facts and figures, but by human emotions like fear, greed, hope, and panic.
Sentiment analysis operates on the principle that extreme emotions often lead to market inefficiencies. When investors become overly optimistic or pessimistic, prices may deviate from their intrinsic values, creating trading opportunities for those who can accurately gauge these emotional extremes.
Key Market Sentiment Indicators
Fear and Greed Index
The Fear and Greed Index combines multiple market indicators to create a single sentiment score ranging from 0 to 100. A low score indicates extreme fear, often associated with oversold conditions and potential buying opportunities. Conversely, a high score suggests extreme greed, which may signal overbought conditions and possible market corrections.
Volatility Index (VIX)
Known as the "fear gauge," the VIX measures expected volatility in the S&P 500 over the next 30 days. High VIX readings typically indicate increased fear and uncertainty, while low readings suggest complacency. Savvy traders often use VIX spikes as contrarian indicators for potential market bottoms.
Put-Call Ratio
This ratio compares the volume of put options (bearish bets) to call options (bullish bets). Extremely high ratios may indicate oversold conditions, while very low ratios might suggest overbought markets. Professional traders often use this as a contrarian indicator.
Insider Trading Activity
Corporate insiders have access to privileged information about their companies. Heavy insider selling might indicate negative sentiment, while significant insider buying could signal confidence in future prospects.
Social Media and News Sentiment
Modern sentiment analysis increasingly relies on real-time data from social media platforms, news outlets, and financial forums. Advanced algorithms can process thousands of posts, articles, and comments to gauge overall market mood.
Twitter Sentiment Analysis
Trading platforms now monitor Twitter feeds for mentions of specific stocks or market-related keywords. The tone and frequency of these mentions can provide early warning signs of shifting sentiment before it's reflected in price movements.
News Sentiment Scoring
Automated systems analyze financial news articles, assigning sentiment scores based on the language used. Positive news coverage typically correlates with bullish sentiment, while negative coverage suggests bearish attitudes.
Reddit and Forum Analysis
Online trading communities like Reddit's WallStreetBets have demonstrated their ability to influence market sentiment dramatically. Monitoring these platforms can provide insights into retail trader sentiment and potential coordinated buying or selling activities.
Technical Sentiment Indicators
Relative Strength Index (RSI)
While primarily a momentum indicator, RSI can reveal sentiment extremes. Readings above 70 often indicate overbought conditions driven by excessive optimism, while readings below 30 suggest oversold conditions reflecting pessimistic sentiment.
Moving Average Convergence Divergence (MACD)
MACD crossovers can signal changes in market sentiment. Bullish crossovers above the signal line may indicate improving sentiment, while bearish crossovers below suggest deteriorating mood.
Bollinger Bands
When prices consistently touch the upper Bollinger Band, it may indicate euphoric sentiment. Conversely, prices hugging the lower band could reflect fearful or pessimistic sentiment.
Implementing Sentiment Analysis in Your Trading Strategy
Contrarian Approach
Many successful traders use sentiment analysis as a contrarian indicator. When sentiment reaches extreme levels, they position themselves opposite to the prevailing mood. This approach capitalizes on the tendency for markets to reverse when emotions reach fever pitch.
Confirmation Tool
Sentiment analysis works best when used alongside other forms of analysis. If technical indicators suggest a potential breakout and sentiment supports the move, the probability of success increases significantly.
Risk Management
Understanding market sentiment can improve risk management decisions. During periods of extreme fear, position sizes might be reduced to account for increased volatility. Conversely, extremely bullish sentiment might warrant tighter stop-losses to protect against sudden reversals.
Tools and Platforms for Sentiment Analysis
Professional Trading Platforms
Many professional trading platforms now integrate sentiment analysis tools directly into their interfaces. These platforms aggregate data from multiple sources to provide real-time sentiment readings alongside traditional charts and indicators.
Sentiment Analysis APIs
Developers and quantitative traders can access sentiment data through various APIs that provide machine-readable sentiment scores. These tools enable the creation of custom trading algorithms that incorporate sentiment data.
Free Resources
Several free resources provide basic sentiment analysis, including the CBOE VIX, various fear and greed indices, and sentiment surveys from organizations like the American Association of Individual Investors (AAII).
Common Pitfalls and Limitations
Lagging Nature of Some Indicators
While some sentiment indicators provide real-time data, others may lag behind actual market conditions. Traditional surveys, for example, might not capture rapidly changing sentiment during volatile periods.
False Signals
Like any analytical tool, sentiment indicators can produce false signals. Extreme readings don't guarantee immediate reversals, and markets can remain in extreme sentiment states longer than expected.
Market Manipulation
The rise of social media has made it easier for individuals or groups to artificially influence sentiment readings through coordinated posting campaigns. Traders must be aware of potential manipulation attempts.
The Future of Sentiment Analysis
Artificial intelligence and machine learning continue to enhance sentiment analysis capabilities. Natural language processing algorithms are becoming more sophisticated at interpreting context and sarcasm in social media posts. Real-time sentiment analysis is becoming more accurate and accessible to retail traders.
The integration of alternative data sources, including satellite imagery, credit card transactions, and mobile location data, promises to provide even more comprehensive sentiment pictures in the future.
Maximizing Your Trading Success with Sentiment Analysis
Market sentiment analysis offers valuable insights that can significantly improve your trading decisions when used correctly. By understanding the emotional drivers behind price movements, you can better time entries and exits, manage risk more effectively, and identify high-probability trading opportunities.
Remember that sentiment analysis works best as part of a comprehensive trading strategy that includes technical and fundamental analysis. No single indicator should drive your trading decisions, but sentiment analysis can provide the crucial psychological context that helps you understand why markets move the way they do.
Start incorporating sentiment analysis into your trading routine by monitoring key indicators like the VIX, tracking social media sentiment for your preferred instruments, and paying attention to extreme readings that might signal potential reversals. With practice and experience, sentiment analysis can become a powerful addition to your trading toolkit.