In the fast-paced world of financial markets, price action tells you where the market has been, but volume tells you why it went there. For traders seeking a deeper understanding of market dynamics, standard volume bars often aren't enough. Enter Delta Volume Analysis—a powerful method that reveals the aggressive buying and selling pressure behind every price move. By mastering this tool, you can peer beneath the surface of the charts to gauge true market sentiment and identify high-probability opportunities.
In this guide, we will dismantle the complexities of delta volume, exploring its key components and practical applications to help you refine your trading edge.
1. What is Delta Volume Analysis and Why Does it Matter?
Delta Volume Analysis is a technique used to measure the difference between the buying and selling volume at each price level or within a specific timeframe. Unlike traditional volume analysis, which simply shows the total number of shares or contracts traded, delta breaks this down into aggressive buying (at the ask price) and aggressive selling (at the bid price).
Why is this distinction critical? Because markets move based on aggression. If there are more aggressive buyers than sellers, price tends to rise, and vice versa. By analysing the delta, you can identify who is currently in control of the market. This insight allows traders to spot potential reversals, confirm trends, and distinguish between a genuine breakout and a trap.
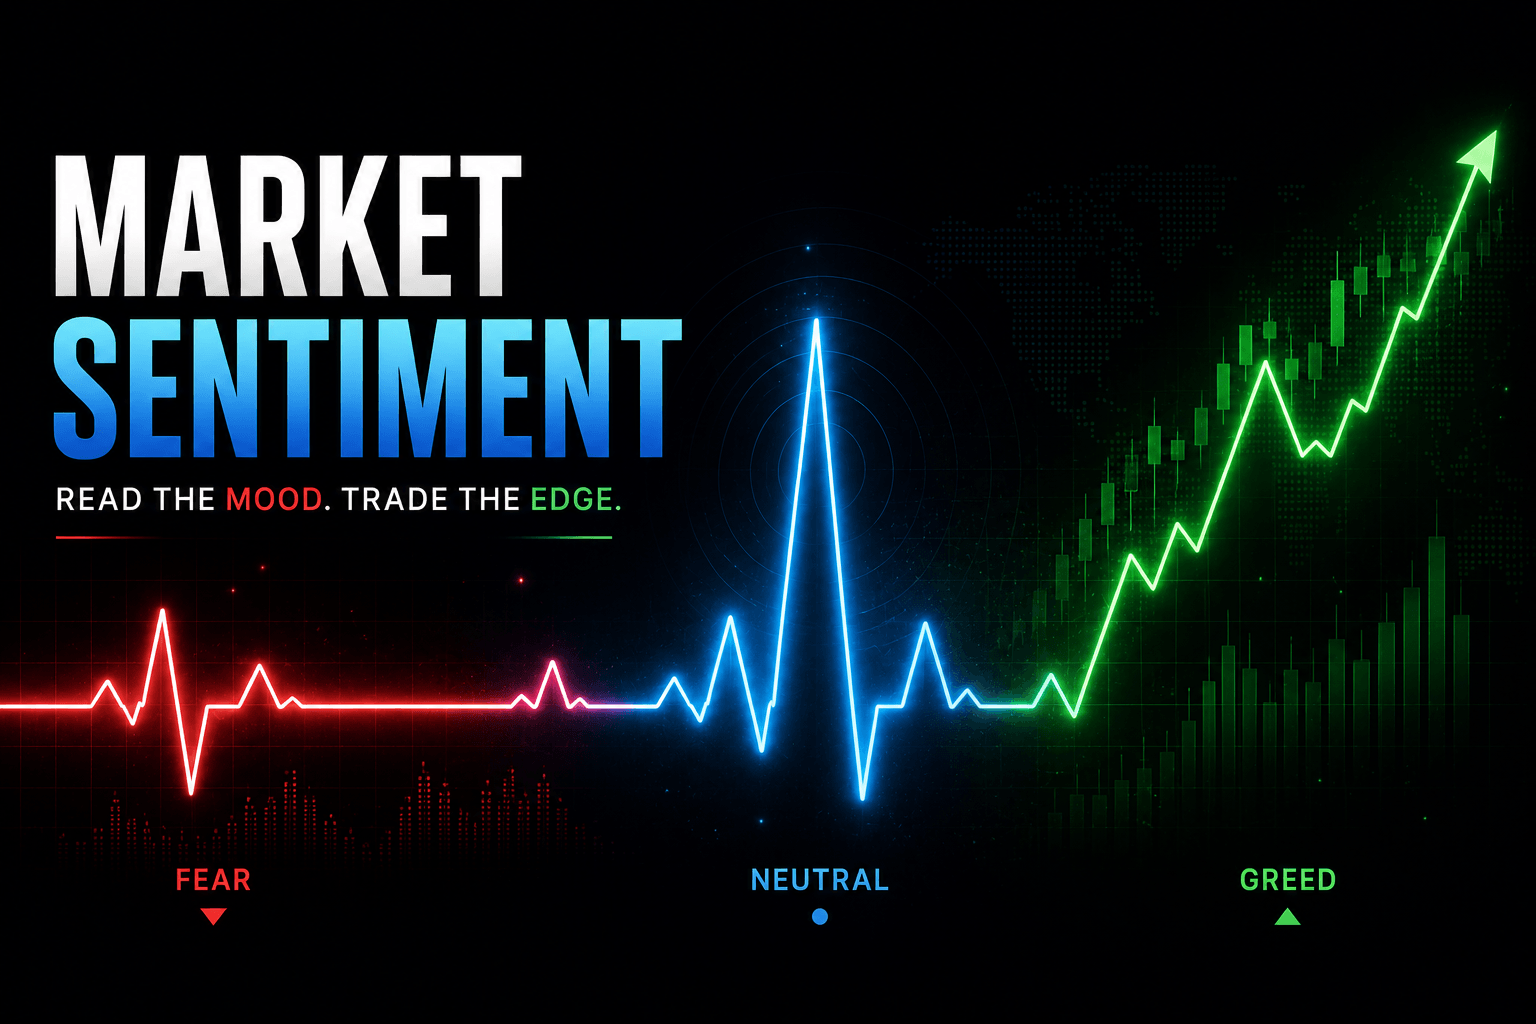
Key Insight: A positive delta indicates net buying pressure, while a negative delta suggests net selling pressure.
2. Key Components: Decoding the Data
To effectively use delta volume, you must understand the three core metrics that drive the analysis. These components provide the raw data needed to interpret market intent.
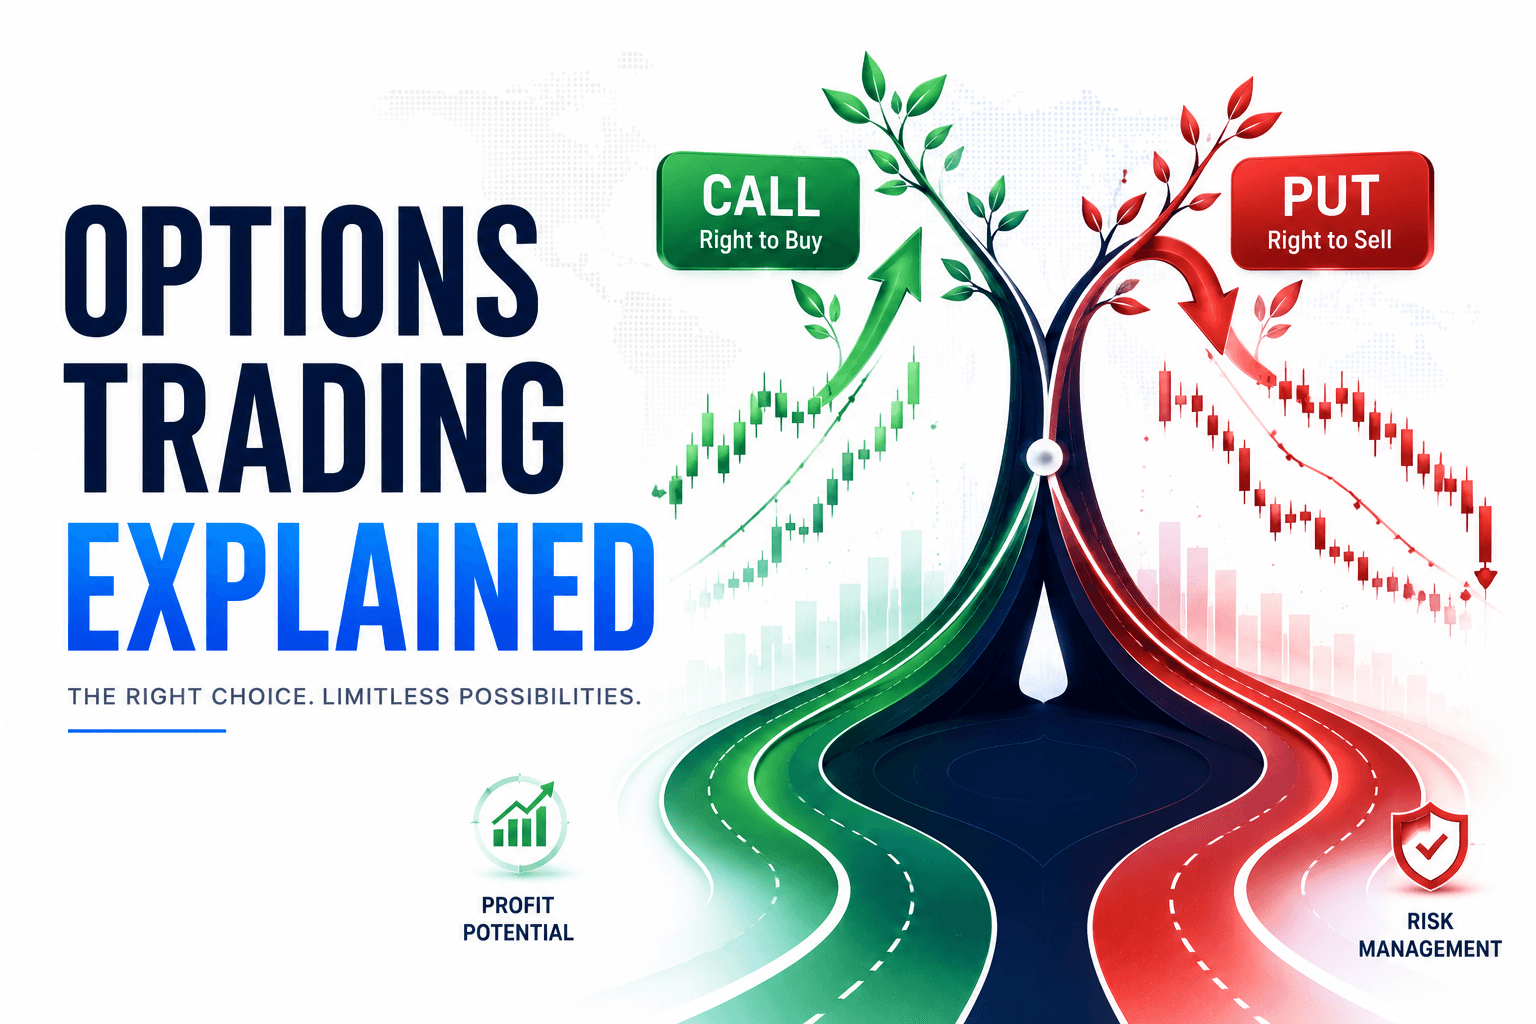
● Bid and Ask Volume: This refers to the volume of trades executed at the bid price versus the ask price. Trades at the ask are considered aggressive buying, whilst trades at the bid are considered aggressive selling.
● Delta: This is the net difference between the Ask Volume and the Bid Volume ($Delta = Ask Volume - Bid Volume$). A positive number means buyers were more aggressive; a negative number means sellers took charge.
● Cumulative Delta: This acts as a running total of the delta over a trading session. It helps visualise the longer-term sentiment, showing whether the overall day is dominated by buyers or sellers, regardless of minor price fluctuations.
Pro Tip: Watch for 'Delta Divergence'. If the price makes a new high but the Cumulative Delta fails to make a new high, it may indicate that buying pressure is exhausted and a reversal is imminent.
3. Practical Applications: Strategies for Day and Swing Trading
Understanding the theory is essential, but applying it to live markets is where the profit potential lies. Delta volume can be integrated into various trading styles, from high-frequency scalping to longer-term swing trading.
● Trend Confirmation: In a healthy uptrend, you want to see both price and delta rising together. If the price is climbing, and the delta bars are consistently green (positive), it confirms that aggressive buyers are fuelling the move.
● Reversal Trading: Look for absorption. This occurs when a market falls into a key support level with high volume, but the price refuses to drop further. If the delta is highly negative (lots of selling) but the price action stalls or creates a doji candle, passive buyers are likely 'absorbing' the sell orders. This is often a precursor to a sharp bounce.
Actionable Advice: Do not use Delta in isolation. Combine it with key support and resistance levels on your chart to increase the probability of your trade setup.
4. Real-World Examples: Delta Analysis in Action
Let us consider a hypothetical scenario on the EUR/USD pair. The price approaches a major resistance level at 1.1200. As it hits this level, the price candles remain small and indecisive. However, upon checking the delta, you notice a massive spike in positive delta.
This scenario indicates that aggressive buyers are trying to push the price up, but passive sellers are absorbing every order at 1.1200. This is often a trap for buyers. Once the buying dries up, the price is likely to reverse sharply downwards as the buyers are forced to close their positions. Recognising this 'effort vs result' anomaly can save you from buying into a false breakout.
5. Tools & Platforms: Equipping Yourself for Success
To perform Delta Volume Analysis, you need a robust trading platform capable of processing tick-by-tick data. Standard charting packages often do not provide this level of granularity.
At My Maa Markets, we offer access to the powerful MetaTrader 5 (MT5) platform. MT5 is renowned for its depth of market (DOM) capabilities and advanced analytical tools, making it an excellent choice for traders who wish to utilise volume analysis.
✅ Advanced Technology: Execute trades with precision using our MT5 infrastructure. ✅ Global Access: Apply your analysis across 275+ instruments, including Forex, Indices, and Commodities. ✅ Competitive Conditions: Benefit from spreads starting from 0.0 pips to ensure your strategy remains cost-effective.
6. Risk Management: Understanding Leveraged Products
While Delta Volume Analysis can provide a significant edge, it does not eliminate risk. Trading leveraged products like Contracts for Difference (CFDs) amplifies both potential profits and potential losses.
● Leverage Awareness: Leverage allows you to control a large position with a small deposit. However, a small market movement against you can lead to substantial losses.
● Stop Losses: Always use stop-loss orders to protect your capital. Delta analysis can help you place tighter stops by identifying the exact price point where your trade thesis is proven wrong.
● Education: Ensure you fully understand the risks involved. We provide educational resources to help you navigate these complexities safely.
7. Conclusion
Delta Volume Analysis transforms trading from a game of guessing to a process of informed decision-making. By understanding the aggressive intent behind price moves, you can spot reversals, confirm trends, and trade with greater confidence. Whether you are scalping the S&P 500 or swing trading major currency pairs, the ability to read order flow is a timeless skill.
Ready to put this knowledge to the test? Open a live account with My Maa Markets today to access institutional-grade platforms, competitive spreads, and the support you need to trade global markets effectively.
Risk Disclaimer: CFDs and Margin FX are leveraged products that carry a high level of risk to your capital. Trading is not suitable for everyone and may result in you losing substantially more than your initial investment. You do not own, or have any right to the underlying assets. You should only trade with money you can afford to lose.