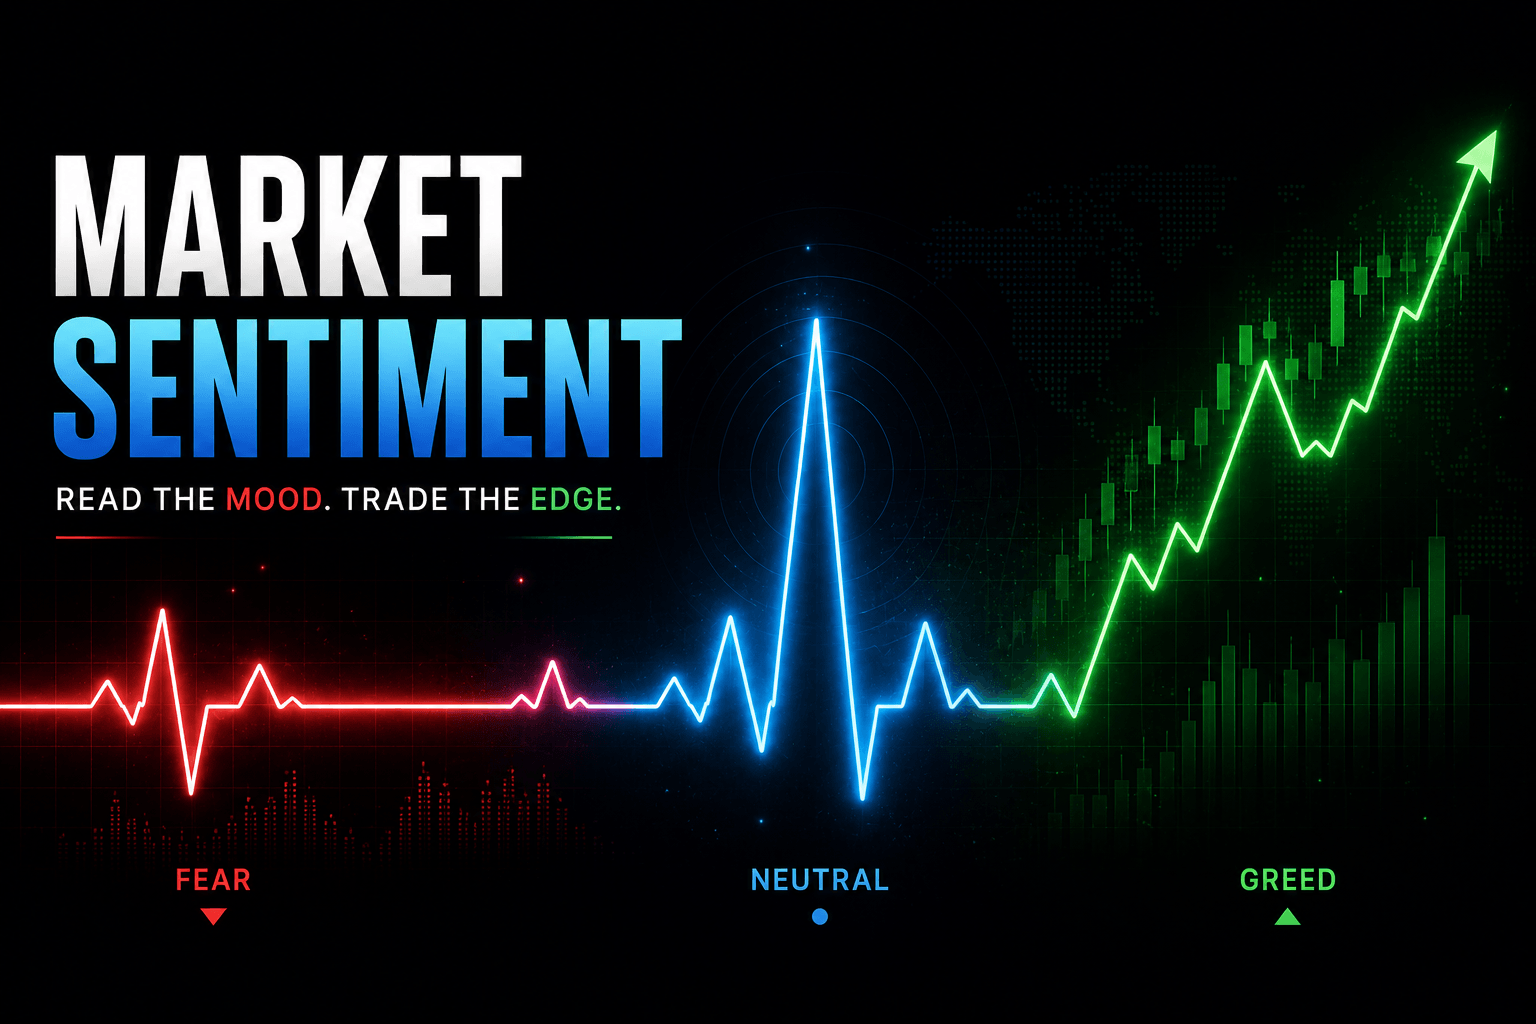
Financial markets often appear chaotic, driven by unpredictable news cycles and shifting sentiment. However, experienced traders know that within this apparent chaos, distinct patterns often emerge. One of the most enduring methods for identifying these patterns is the Elliott Wave Theory. Developed by Ralph Nelson Elliott in the 1930s, this theory suggests that market prices unfold in specific patterns driven by investor psychology.
By mastering Elliott Wave Theory, you gain more than just a technical indicator; you gain a roadmap that helps you contextualise current price action within a broader trend. Whether you are trading Forex pairs like EURUSD or commodities like Gold on our MT5 platform, understanding these waves can significantly enhance your market analysis. In this guide, we break down the theory into six essential components to help you trade with greater confidence and precision.
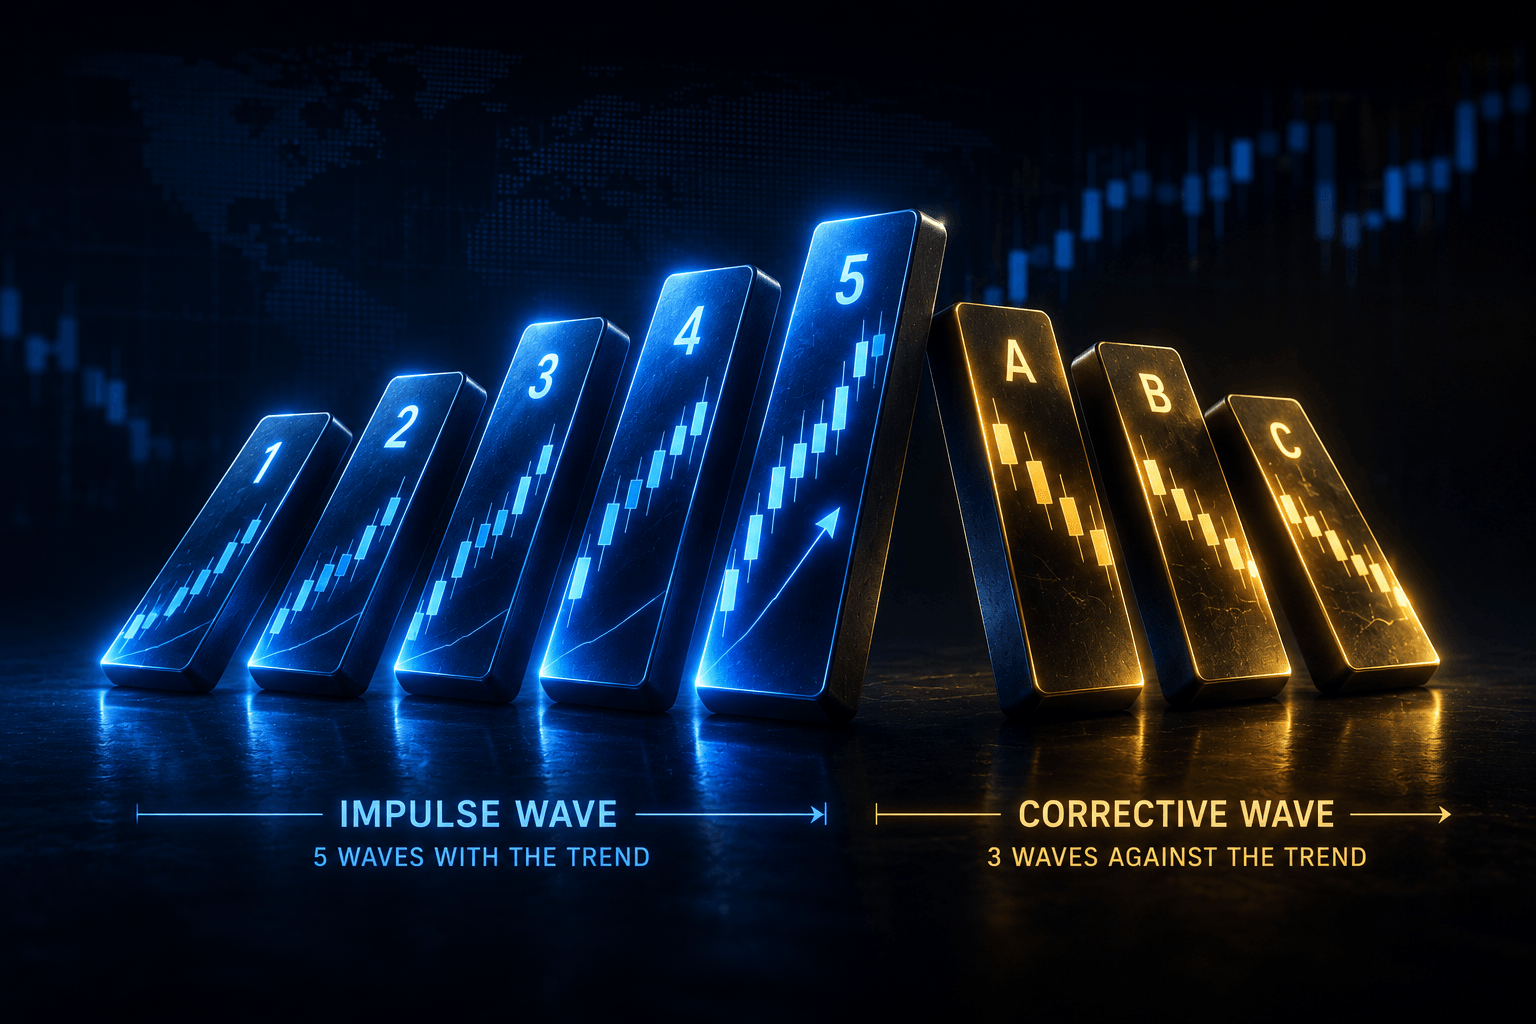
1. The Impulse Wave
The foundation of Elliott Wave Theory lies in the 'Impulse Wave'. This is a five-wave pattern that moves in the direction of the primary trend. It reflects the crowd's enthusiasm and is where the most significant price moves occur. The pattern consists of three 'motive' waves (labeled 1, 3, and 5) which drive the price forward, and two 'corrective' waves (labeled 2 and 4) which offer brief pauses or retracements.
To identify an impulse wave correctly, you must adhere to specific rules: Wave 2 cannot retrace more than 100% of Wave 1, and Wave 3 can never be the shortest of the three motive waves. In fact, in many markets, particularly equities and Forex, Wave 3 is typically the longest and strongest. A practical tip for traders is to wait for the confirmation of Wave 3; attempting to catch the very bottom of Wave 1 is risky, whereas trading the breakout into Wave 3 often offers a higher probability setup.
2. The Corrective Wave
Trends do not move in straight lines forever. After a five-wave impulse sequence is complete, the market enters a 'Corrective Wave' phase. This is a three-wave pattern, labeled A, B, and C, which moves against the main trend. These corrections are essential for the market to consolidate gains before the next major move begins.
Corrective waves are notoriously difficult to trade because they are more complex and variable than impulse waves. They can take the form of zig-zags, flats, or triangles. For instance, in a 'flat' correction, the price moves sideways rather than making a deep retracement. Traders should exercise extreme caution here. Rather than trading aggressively against the trend during a correction, use this phase to identify entry points for the resumption of the dominant trend once the C-wave concludes.
3. Fibonacci Ratios
Elliott Wave Theory and Fibonacci ratios are inextricably linked. The theory relies heavily on these mathematical ratios to predict where waves will begin and end. For example, Wave 2 typically retraces 50% or 61.8% of Wave 1. Similarly, Wave 3 is often 1.618 times the length of Wave 1.
By applying the Fibonacci retracement and extension tools available on the MY MAA MARKETS MT5 platform, you can set precise price targets. If you identify a potential Wave 4 pullback, look for support at the 38.2% Fibonacci level of Wave 3. Using these mathematical benchmarks adds a layer of objectivity to your analysis, reducing the guesswork often associated with visual pattern recognition.
4. Wave Extensions
Markets sometimes move with exceptional momentum, leading to a phenomenon known as 'Wave Extensions'. An extension occurs when one of the impulse waves (usually Wave 3) becomes elongated and subdivides into its own five-wave sequence. This essentially means you get a trend within a trend, resulting in a move that is significantly larger than anticipated.
Recognising an extension is crucial for trade management. If you exit a trade too early because you counted a standard five waves, you might miss out on substantial profits as the extension continues to unfold. If Wave 3 extends, it is highly probable that Wave 1 and Wave 5 will be roughly equal in length. Keeping this symmetry in mind can help you adjust your profit targets dynamically as the market evolves.
5. Common Mistakes
While powerful, Elliott Wave Theory is subjective, and subjectivity can lead to errors. The most common mistake traders make is 'forcing the count'. This happens when a trader has a bias regarding market direction and tries to fit the wave count to match that bias, ignoring the strict rules of the theory.
Another frequent error is trading every single wave. Not every wiggle on a chart is a clear Elliott Wave pattern. It is vital to accept that sometimes the count is unclear. In such cases, the prudent approach is to step aside and wait for clarity. Remember, capital preservation is just as important as profit generation. If the chart looks messy, it is better to wait for a high-confidence setup than to risk capital on an ambiguous pattern.
6. Combining with Other Indicators
Experienced traders rarely use Elliott Wave Theory in isolation. To increase the probability of success, it is best combined with other technical indicators for confirmation. Oscillators like the Relative Strength Index (RSI) or the Moving Average Convergence Divergence (MACD) are particularly useful.
For example, a common signal occurs at the end of Wave 5. Prices may make a new high (in an uptrend), but the RSI might fail to make a new high, creating 'divergence'. This divergence serves as a strong warning that the trend is exhausted and a reversal is imminent. By cross-referencing your wave count with momentum indicators, you add a necessary layer of verification to your trading strategy.
Empower Your Trading Strategy
Understanding Elliott Wave Theory provides a structured way to analyse market movements, but applying it effectively requires the right environment. Whether you are looking to test your wave counting skills on a demo account or are ready to apply them to live markets with spreads from 0.0 pips, having a robust platform is essential.
At MY MAA MARKETS, we offer the advanced tools and 24/7 expert support you need to navigate the markets with precision. Open an account today to access over 275 trading instruments and start applying your knowledge on a regulated, secure platform.
Risk Warning: Trading involves significant risk and may not be suitable for all investors. You should carefully consider your investment objectives, experience level, and risk appetite. Only invest money you can afford to lose.