Many traders rely on horizontal support and resistance lines, but the market moves in two dimensions: price and time. W.D. Gann, a legendary trader from the early 20th century, theorised that specific geometric angles could predict future price movements with remarkable accuracy. By mastering Gann Angles, you can add a powerful, time-tested dimension to your technical analysis.
This guide breaks down the complexity of Gann theory into actionable steps. Whether you are trading Forex, Metals, or Indices on My Maa Markets' robust MT5 platform, understanding these angles can help you identify trends, forecast reversals, and manage risk more effectively.
1. Introduction to Gann Angles: What are Gann Angles and Why Use Them?
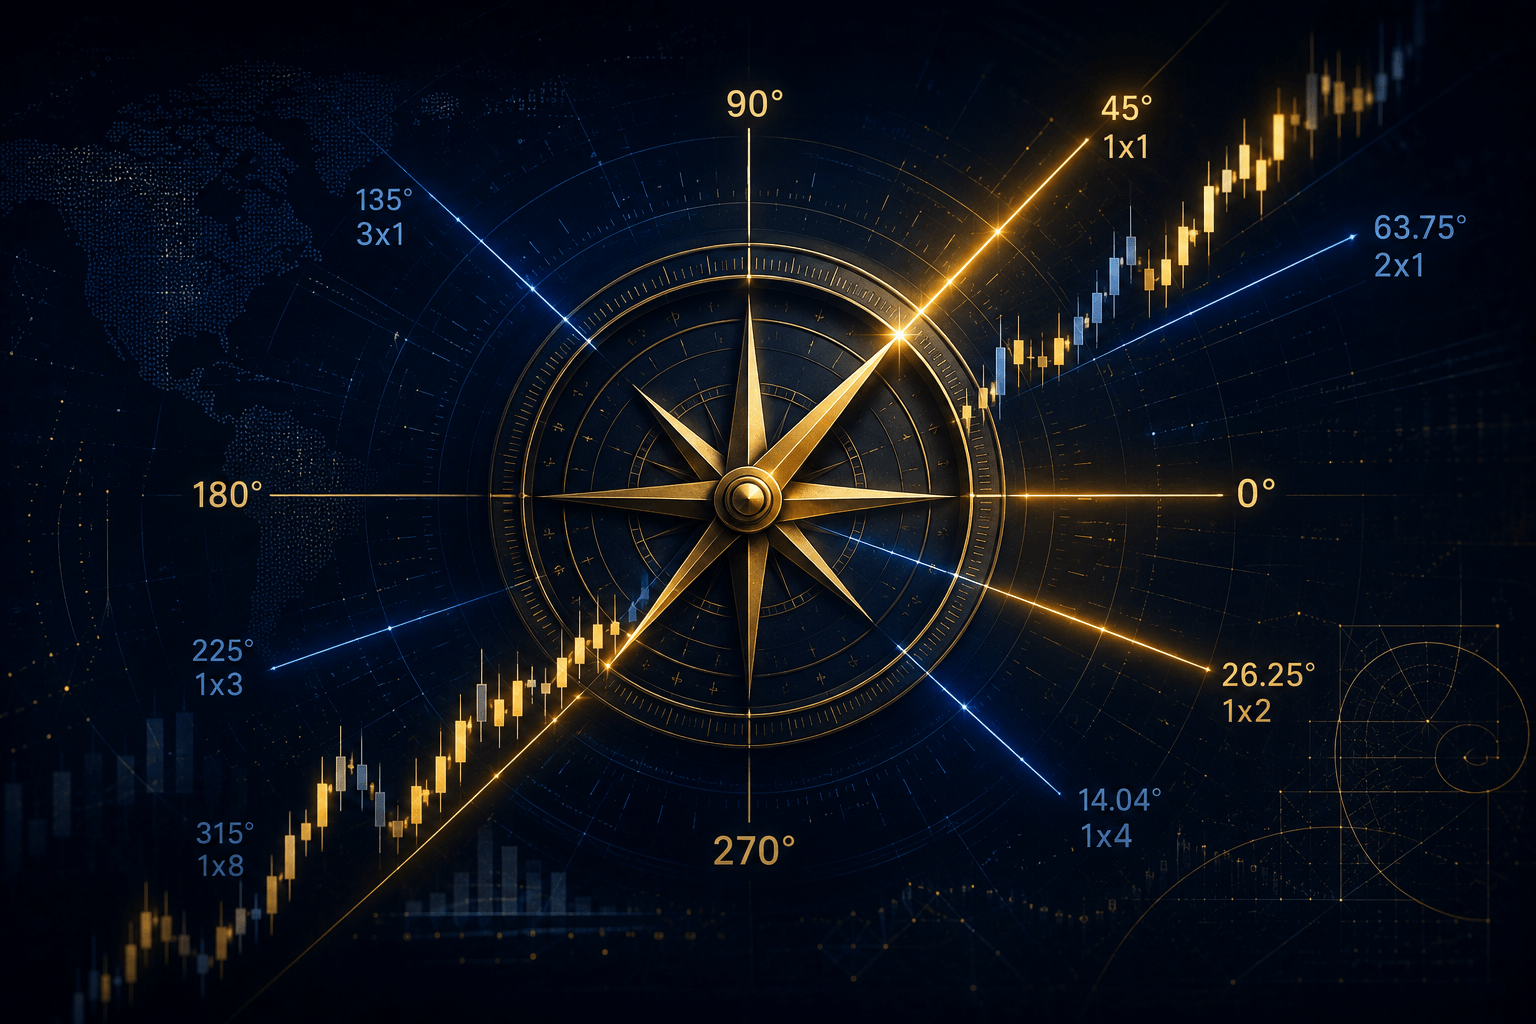
Gann Angles are diagonal lines drawn on a price chart that represent a fixed relationship between time and price. The most significant angle is the 45-degree line, also known as the 1x1 angle, which represents one unit of price for one unit of time. According to Gann, when price is above this angle, the market is in a strong uptrend; when below, it is in a downtrend.
Unlike simple trendlines which connect random price points, Gann Angles are mathematical. They allow traders to gauge the strength of a trend. If a trend is moving steeper than the 45-degree angle, it is considered strong but potentially unsustainable. If it is shallower, the trend is weak or correcting.
Tip: Think of the 1x1 angle as the "true" path of the market. If the price strays too far from it, expect a reversion to the mean.
2. Understanding Gann's Key Concepts: The Square of 9 and Cardinal Angles
To effectively use the angles, one must grasp the underlying geometry. Gann used the "Square of 9"—a spiral of numbers—to calculate significant price levels and time intervals. This tool helps identify Cardinal Angles (0, 90, 180, 270, 360 degrees), which often act as major turning points in the market.
For example, on a daily chart for Gold (XAUUSD), price reversals frequently occur at mathematical intervals related to the historical high or low. By mapping these cardinal points, traders can anticipate dates where volatility is likely to spike.
Tip: You do not need to calculate the Square of 9 manually. Modern platforms like MetaTrader 5 (MT5) have these tools integrated, allowing you to overlay the geometry directly onto your chart.
3. How to Construct Gann Angles: Step-by-Step Guide
Constructing these angles correctly is critical; a misplaced angle can lead to false signals. To draw them, you must first identify a significant pivot point—a major high or low on the chart.
- Select the Gann Fan tool on your trading platform.
- Locate a significant swing low (for an uptrend) or swing high (for a downtrend).
- Drag the tool to the right.
- Ensure the 1x1 line is at a 45-degree angle relative to the time and price scale.
Tip: Chart scaling is vital. For Gann Angles to work, your chart needs to be "squared." This means ensuring the distance between price units and time units is consistent. On MT5, check your scale settings to ensure a fixed ratio (often 1:1) before drawing.
4. Using Gann Angles for Support and Resistance: Identifying Key Levels
Once drawn, the fan of angles (1x1, 1x2, 2x1, etc.) acts as dynamic support and resistance zones. As price moves through time, these angled lines provide levels where the price is likely to bounce or break through.
For instance, in an uptrend, if the price falls through the 1x1 angle, the next likely support level is the 2x1 angle (two units of time for one unit of price). If that holds, the trend is still intact but slowing down. If it breaks, a deeper correction is likely.
Tip: Watch for price action "clusters" where a Gann Angle intersects with a horizontal support level. These intersections often represent high-probability trade setups.
5. Combining Gann Angles with Other Indicators: Enhancing Trading Strategies
While powerful, Gann Angles should rarely be used in isolation. To increase the probability of a successful trade, combine them with other technical indicators available on the My Maa Markets platform.
● RSI (Relative Strength Index): If price hits a Gann resistance angle and the RSI is showing overbought conditions (>70), the likelihood of a reversal increases.
● Moving Averages: Use a 50-day or 200-day moving average to confirm the trend direction suggested by the angles.
Tip: Look for "confluence." A signal is strongest when a Gann Angle, a Fibonacci retracement level, and a moving average all align at the same price point.
6. Risk Management with Gann Angles: Protecting Your Investments
Gann himself was a staunch advocate of capital preservation. He believed that even the best system fails without risk management. You can use the angles to place precise stop-loss orders.
If you enter a long position because price bounced off the 1x1 angle, a logical place for your stop-loss is just below that angle. As time progresses and the angle rises, you can trail your stop-loss along the line to lock in profits while maintaining protection.
Tip: Never risk more than 1-2% of your account balance on a single trade. Trading involves significant risk, and using tools like stop-losses is essential for longevity in the markets.
7. Real-Life Examples of Gann Angle Trading: Case Studies
Let's look at the EURUSD pair. During periods of high volatility, you might observe the price shooting up rapidly, following the 2x1 angle (a steep ascent). Eventually, the momentum fades, and the price breaks this angle.
Historically, after breaking a steep 2x1 angle, the price often drifts sideways or corrects down to meet the 1x1 angle. Traders who recognize this break can exit their aggressive long positions or initiate short-term sell positions, targeting the 1x1 line as a profit objective.
Tip: Backtest these scenarios on historical data using a Demo Account to see how different assets respect different angles.
8. Common Mistakes to Avoid: Gann Angle Trading Pitfalls
The most common error traders make is improper scaling. If you zoom in or out of your chart and the angles change slope relative to the price bars, your scale is not fixed, and the angles are invalid.
Another mistake is forcing the market to fit the theory. If the price is consistently ignoring your angles, you may have chosen the wrong pivot point to start your fan. The market is always right; if the geometry doesn't fit, redraw from a more significant high or low.
Tip: Stick to higher timeframes like the Daily or Weekly charts. Gann angles are generally more reliable over longer periods than on 1-minute or 5-minute charts.
9. Resources for Learning More: Books, Courses, and Tools
Gann theory is deep, and continuous education is key to mastering it. W.D. Gann wrote several books, including “How to Make Profits in Commodities” and “45 Years in Wall Street,” which are excellent primary sources.
Additionally, leveraging the educational resources provided by your broker is crucial. My Maa Markets offers Education Central, featuring high-quality instructional videos and strategies that can help clarify complex technical analysis concepts.
Tip: Start by mastering one instrument. Every asset class (Forex, Metals, Indices) has a unique "vibration" or price personality. Master Gann analysis on Gold or the S&P 500 before applying it everywhere.
10. Conclusion: Mastering Gann Angles for Trading Success
Mastering Gann Angles requires patience, practice, and a disciplined approach to chart construction. However, once understood, they offer a unique ability to see where price should be at a specific time, giving you a distinct edge in the markets. By combining this geometric perspective with robust risk management and a reliable execution platform, you position yourself to trade with greater confidence.
Ready to test these strategies on the live markets? Open an account with My Maa Markets today to access advanced MT5 charting tools, spreads from 0.0 pips, and a regulated environment designed for your success.
Disclaimer: Trading CFDs and Margin FX carries a high level of risk to your capital and may not be suitable for everyone. You should only trade with money you can afford to lose. Ensure you fully understand the risks involved.